본문으로 건너뛰기
Defense
90 min

Map Control — from natural-language commands to nautical-chart coordinate resolution

Walk one cycle of routing operator natural-language commands through intent classification → tactical zone lookup → coordinate resolution, driving automated pan / zoom / overlay on an electronic nautical chart.

Workshop goal

By the time you finish this Workshop, you will have walked through one full cycle of the following flow inside D.Hub.

  • Load a single scenario into portal so that two sub-collections (tactical_data for definitions and map_ops for runtime), 4 datasets, 3 code nodes, 3 pipelines, an ontology with 3 entities and 2 relations, a dashboard, one knowledge, and one agent are all registered together.
  • Inspect 7 tactical zone types (safety / operation / patrol / boundary / ADIZ / surveillance / port control) defined for the maritime operations domain.
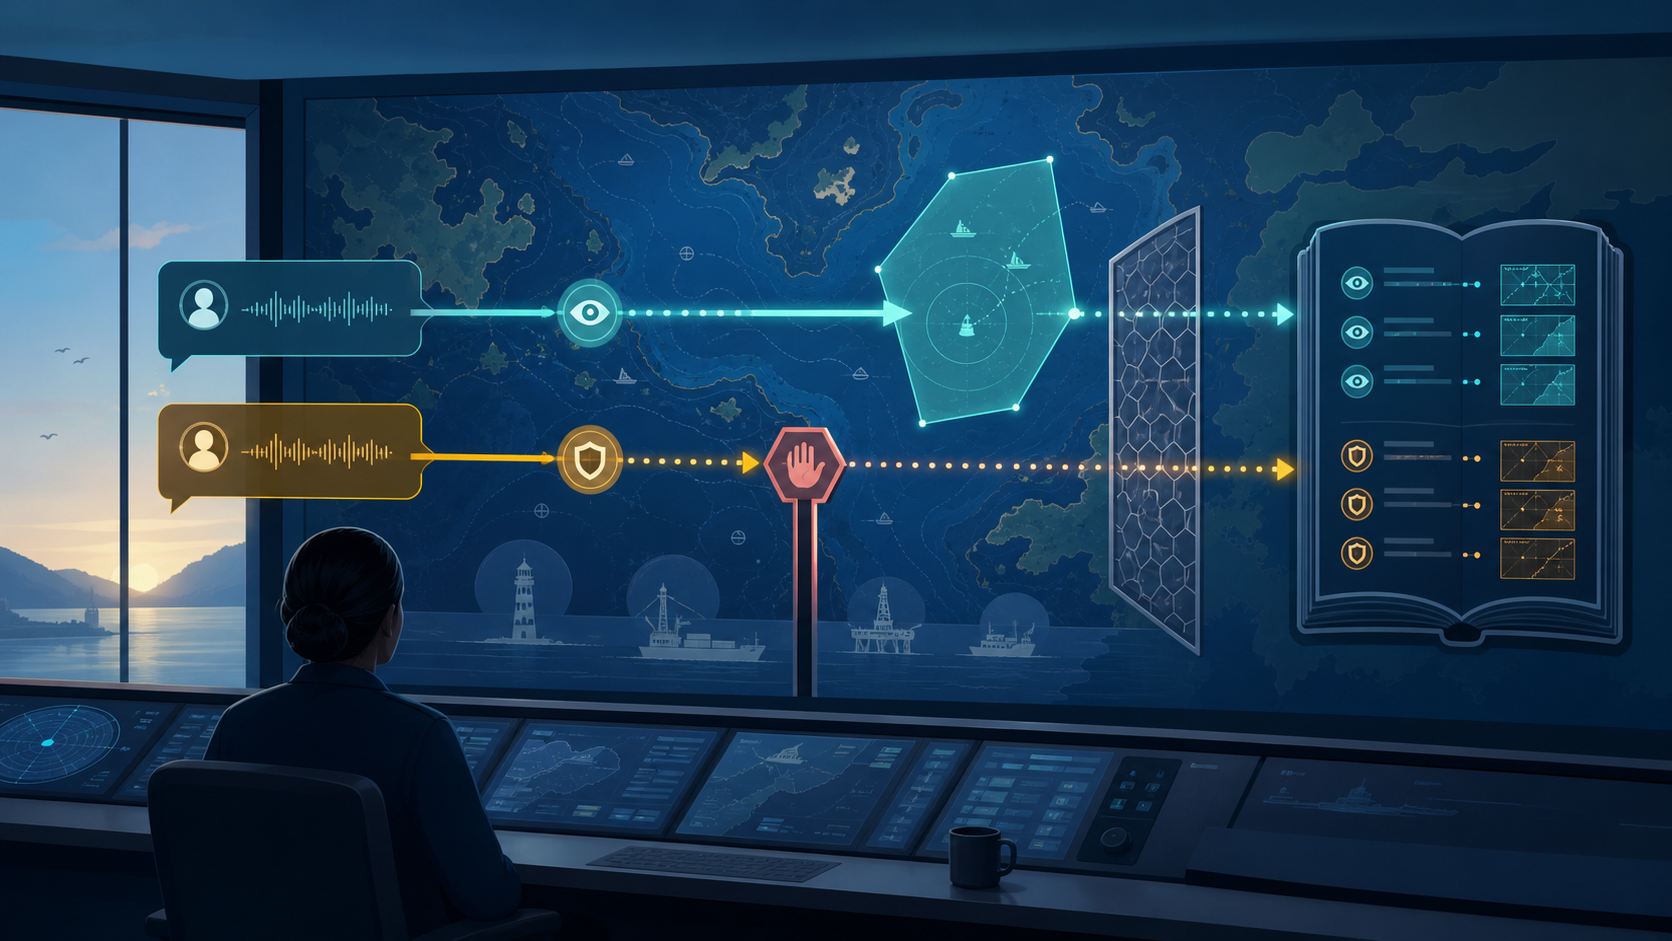
  • Walk through the map_control agent's 5-step workflow: classify an operator's natural-language command (e.g. "Show me the 15NM safety zone") into intent → look up zone → resolve WGS84 coordinates → determine zoom level → emit structured JSON.
  • Confirm that every command call is logged to om_event_history as an audit trail of who · what · when · where.
  • Expand mc_tactical_zonemc_graphic_overlaymc_event_history graph to see command call history for one zone on one screen.
  • Read the map_operations dashboard for intent distribution / user activity from the operator's vantage point.

The core lesson is the pattern of unpacking natural-language commands into structured actions and handing them off to external UI systems. Recommended duration: 90 minutes.

Prerequisites

  • An analyst or engineer account with access to D.Hub portal (Editor or higher)
  • ~44 KB of download room for one scenario zip

1. Load the scenario (10 min)

map_control.zip Download(45 KB)

Go to Collections → more (⋯) menu → Import (가져오기) and upload the zip.

Following manifest.json, the import creates the following in order:

  1. Two collections — tactical_data (alias: Tactical Data), map_ops (alias: Map Operations)
  2. Four datasets — om_tactical_zone (tactical_data), om_graphic_overlay (tactical_data), om_event_history (map_ops), ui_control_parameters (map_ops)
  3. Three codes (Python) — zone_resolver, parameter_formatter, build_map_control_ontology
  4. Three pipelines — zone_data_ingestion, map_control_execution, ontology_materialization
  5. Ontology — 3 entities (mc_tactical_zone, mc_graphic_overlay, mc_event_history), 2 relations (mc_has_spatial_coordinates, mc_referenced_in_event)
  6. One knowledge — operation_guide (operations guide — intent classification criteria + output schema)
  7. One dashboard — map_operations
  8. One agent — map_control (natural language → coordinates)

2. Browse the tactical-zone definitions (10 min)

Open the tactical_data collection. The scenario's starting point is tactical zone definitions.

om_tactical_zone (8 rows) — Columns: zone_id, zone_name, zone_type (safety / operational / patrol / boundary / adiz / surveillance / port_control), description, priority_level, created_at. The seed data defines 8 zones in Korean territorial waters (e.g. 15NM Safety Zone, Operational Zone Alpha, Patrol Zone B-3, Busan Port Entry/Exit Control Zone).

om_graphic_overlay (8 rows) — WGS84 coordinates and recommended zoom level for the same 8 zones. Columns: overlay_id, zone_id (foreign key), center_longitude, center_latitude, recommended_zoom_level, boundary_polygon (WKT text), display_color.

The separation between the two is intentional. Splitting zone semantics (tactical definition) from zone coordinates (geographic representation) means coordinate updates don't disturb semantics, and vice versa. The §3 pipeline joins them by zone_id into one operational table.

3. Operational pipeline — zone data integration (15 min)

In the map_ops collection's Pipelines section, open zone_data_ingestion. One node — zone_resolver combines the two inputs.

zone_resolver processing:

  1. Inner-join om_tactical_zone + om_graphic_overlay on zone_id.
  2. Normalize WGS84 coordinates to decimal degree standard (convert DMS format if input).
  3. Fill missing recommended_zoom_level with zone_type-specific defaults (e.g. port_control = 11, patrol = 8).
  4. Output ui_control_parameters — Columns: zone_id, zone_name, zone_type, longitude, latitude, zoom_level, display_color, priority_level.

This one table is the form the UI can consume directly per command. The next-step agent's core job is to unpack a natural-language command into one row of this table.

Press Run. When it finishes, open ui_control_parameters and confirm all 8 rows carry populated coordinates and zoom.

4. Intent classification + safety gating (10 min)

This is the Workshop's safety design core. The map_control agent's first tool is classify_intent — the LLM classifies a natural-language command into one of three intents.

  • UI_CONTROLElectronic nautical chart control intent (pan / zoom / overlay display). Allowed.
  • DATA_QUERYData query intent (e.g. "Tell me which zones got patrolled today"). Blocked (a separate operational data tool should handle this).
  • SYSTEM_CONFIGSystem configuration change intent (e.g. "Change the screen color"). Blocked (requires separate admin privileges).

Blocked intents don't enter the map_control_execution pipeline. The response reads "This command is out of this agent's scope. Please use the ___ tool.".

This allow-list gating is the standard safety pattern that narrows the agent's misbehavior surface. Even if the intent-classification LLM operates with a single-digit error rate, the probability that an out-of-allowlist intent slips through is a multiplicative step lower (it would have to be misclassified as UI_CONTROL to pass).

5. One agent cycle — command → coordinates (20 min)

In the map_ops collection's Agents section, open map_control and start a new session.

The agent's 5-step workflow:

  1. classify_intent — Classify the natural-language command into UI_CONTROL / DATA_QUERY / SYSTEM_CONFIG (§4).
  2. lookup_zone — For UI_CONTROL, find the best-matching row in ui_control_parameters against the command's zone keyword (exact match first, fuzzy match as fallback).
  3. resolve_coordinates — Extract longitude, latitude, zoom_level from the matched row. Relative location expressions (e.g. "10 NM out from Busan offshore") compute bearing and distance from the reference zone's coordinates.
  4. format_parameters — Emit structured JSON the external UI consumes: {"command": "pan_and_zoom", "longitude": 129.12, "latitude": 35.05, "zoom": 8, "zone_id": "Z-003", "overlay_color": "#ff0000"}.
  5. log_event — Record one call as one row in om_event_history. Columns: event_id, user_id, command_text, intent, target_zone_id, output_json, created_at.

In the session, enter the following commands in order. The seed om_tactical_zone carries 8 zones — 15NM Safety Zone, Operational Zone Alpha, Patrol Zone B-3, Jinhae Bay Boundary Zone, Jeju South ADIZ, East Sea Operational Zone Charlie, West Sea NLL Surveillance Zone, Busan Port Entry/Exit Control Zone — so the zone keywords in the commands map directly.

  • Command 1: "Show me the 15NM safety zone" — Classifies as UI_CONTROL; the coordinates and zoom for TZ-001 emit as JSON.
  • Command 2: "Zoom in to Busan Port Entry/Exit Control Zone" — Matches TZ-008 and zooms +2 above the port_control recommended zoom level.
  • Command 3: "Tell me today's patrol history" — Classifies as DATA_QUERY and returns a rejection response. The rejection is also logged as one row in om_event_history.

After each command, switch to om_event_history's preview and confirm one row per call was recorded.

6. Ontology + graph exploration (10 min)

Run ontology_materialization. build_map_control_ontology reads the 4 datasets in batch mode and lands the 3 entities + 2 relations in upsert mode.

EntityKeyKey attributes
mc_tactical_zonezone_idzone_name, zone_type, priority_level
mc_graphic_overlayoverlay_idlongitude, latitude, zoom_level, display_color
mc_event_historyevent_iduser_id, intent, command_text, created_at

Relations × 2:

  • mc_has_spatial_coordinates (mc_tactical_zonemc_graphic_overlay)
  • mc_referenced_in_event (mc_tactical_zonemc_event_history) — Linked when a command targeted that zone

In the Graph explorer, surface command call history for one zone on one screen.

MATCH (z:mc_tactical_zone {zone_type: 'port_control'})-[:mc_referenced_in_event]->(e:mc_event_history)
OPTIONAL MATCH (z)-[:mc_has_spatial_coordinates]->(o:mc_graphic_overlay)
RETURN z, o, e
ORDER BY e.created_at DESC
LIMIT 20

One port-control zone's 20 most recent command events fall out. When the same zone fires multiple commands in a short window, that's an operator-attention spike signal; when one zone gets concurrent commands from different users, that's a shared operations window signal.

7. Dashboard + next steps (10 min)

The map_operations (alias: Map Operations Dashboard) dashboard's 4 widgets all read from om_event_history.

  • Total Events (statistic) — COUNT(*)
  • Events by Intent Type (donut) — Counts per intent_type (UI_CONTROL / DATA_QUERY / SYSTEM_CONFIG distribution)
  • Events by User (bar, Top 20) — Counts per user_id descending
  • Recent Events (data table) — 100 most recent rows by created_at desc

The key operational signal is the Events by Intent Type donut. If the rejected-intent ratio (DATA_QUERY + SYSTEM_CONFIG) stays consistently above 30%, audit two things at once — whether the LLM's allow-list conservatism is too tight, and whether operators are routing intents that belong elsewhere through this agent. Both are next-round topics.

The Recent Events table is the audit-trail surface. Each row records who · what · when · with which intent, mapping directly to operator-style recent-activity review. Time-of-day trend / zone-access-pattern widgets aren't built into the seed; once operational data accumulates and analytical needs sharpen, adding those widgets is a natural follow-up.

Next directions:

  • The Agents Path (Phase 2) covers the allow-list gating pattern as it maps onto other domains.
  • Map *your own domain's command → structured action flow (smart factory work orders, call center customer responses) onto this shape.

Verification checklist

  • Both tactical_data and map_ops collections appear in the tree with 4 datasets loaded.
  • After zone_data_ingestion, all 8 rows of ui_control_parameters carry populated longitude · latitude · zoom_level columns.
  • After the 3-command session cycle, om_event_history records exactly 3 rows (the DATA_QUERY rejection must also leave one row).
  • In the Graph explorer, starting from one mc_tactical_zone you can expand both neighbors — coordinates (mc_graphic_overlay) and events (mc_event_history) — on one screen.
  • The map_operations dashboard's Events by Intent Type donut shows UI_CONTROL as the largest slice, with DATA_QUERY and SYSTEM_CONFIG reflected as rejection statistics.