Clean the raw data and build a daily mart with code
What you will learn
Use Polars to rename the API columns and summarize 72 hourly rows into a three-row daily mart.
The src_weather_hourly dataset from lesson 03 preserves the API response. This lesson adds a second Python code resource that gives the columns readable names and summarizes 72 hourly rows into three daily rows.
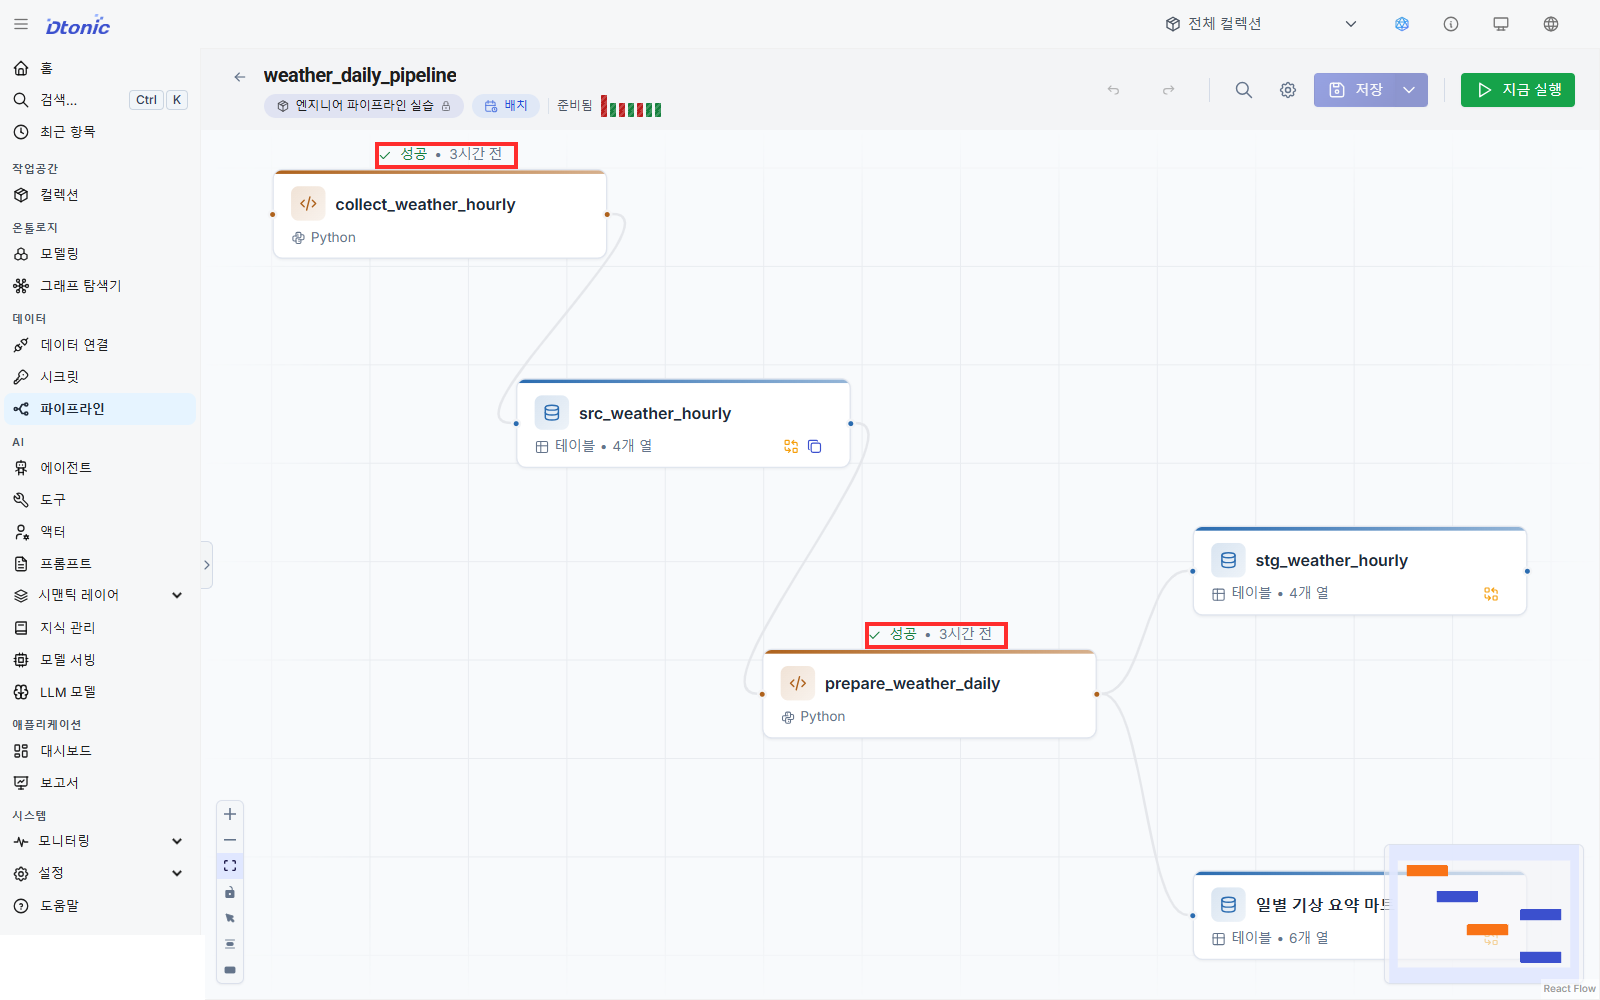
collect_weather_hourly → src_weather_hourly → prepare_weather_daily
                                              ├→ stg_weather_hourly
                                              └→ mart_weather_daily
Confirm the result datasets
Lesson 03 created these datasets:
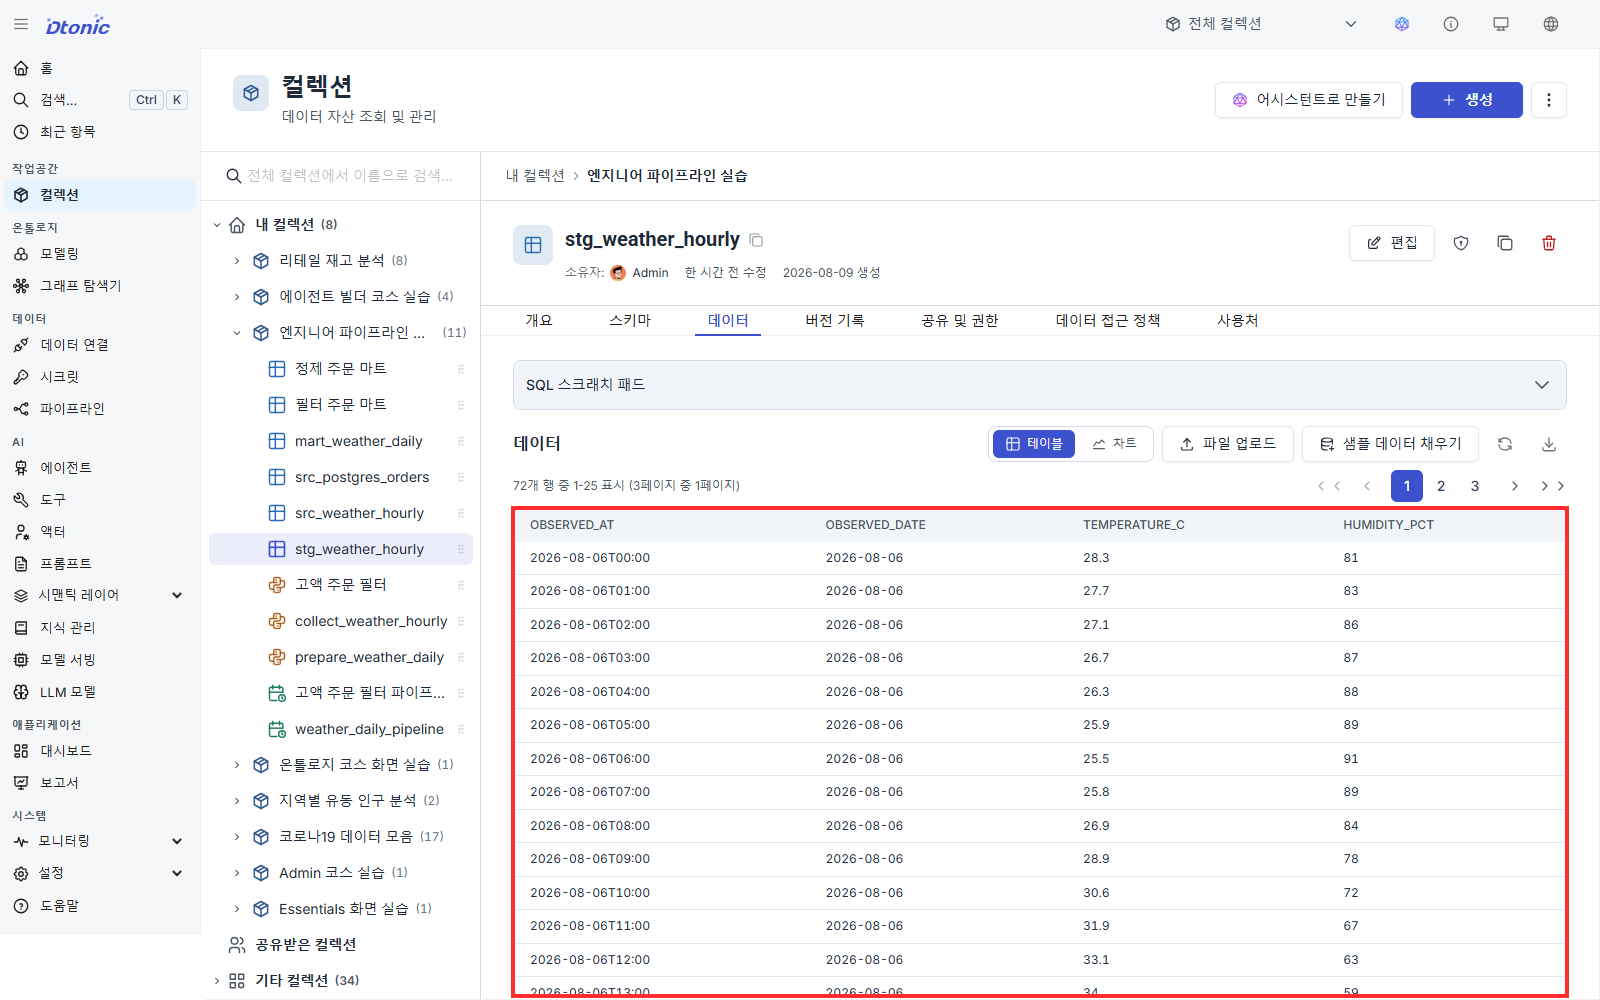
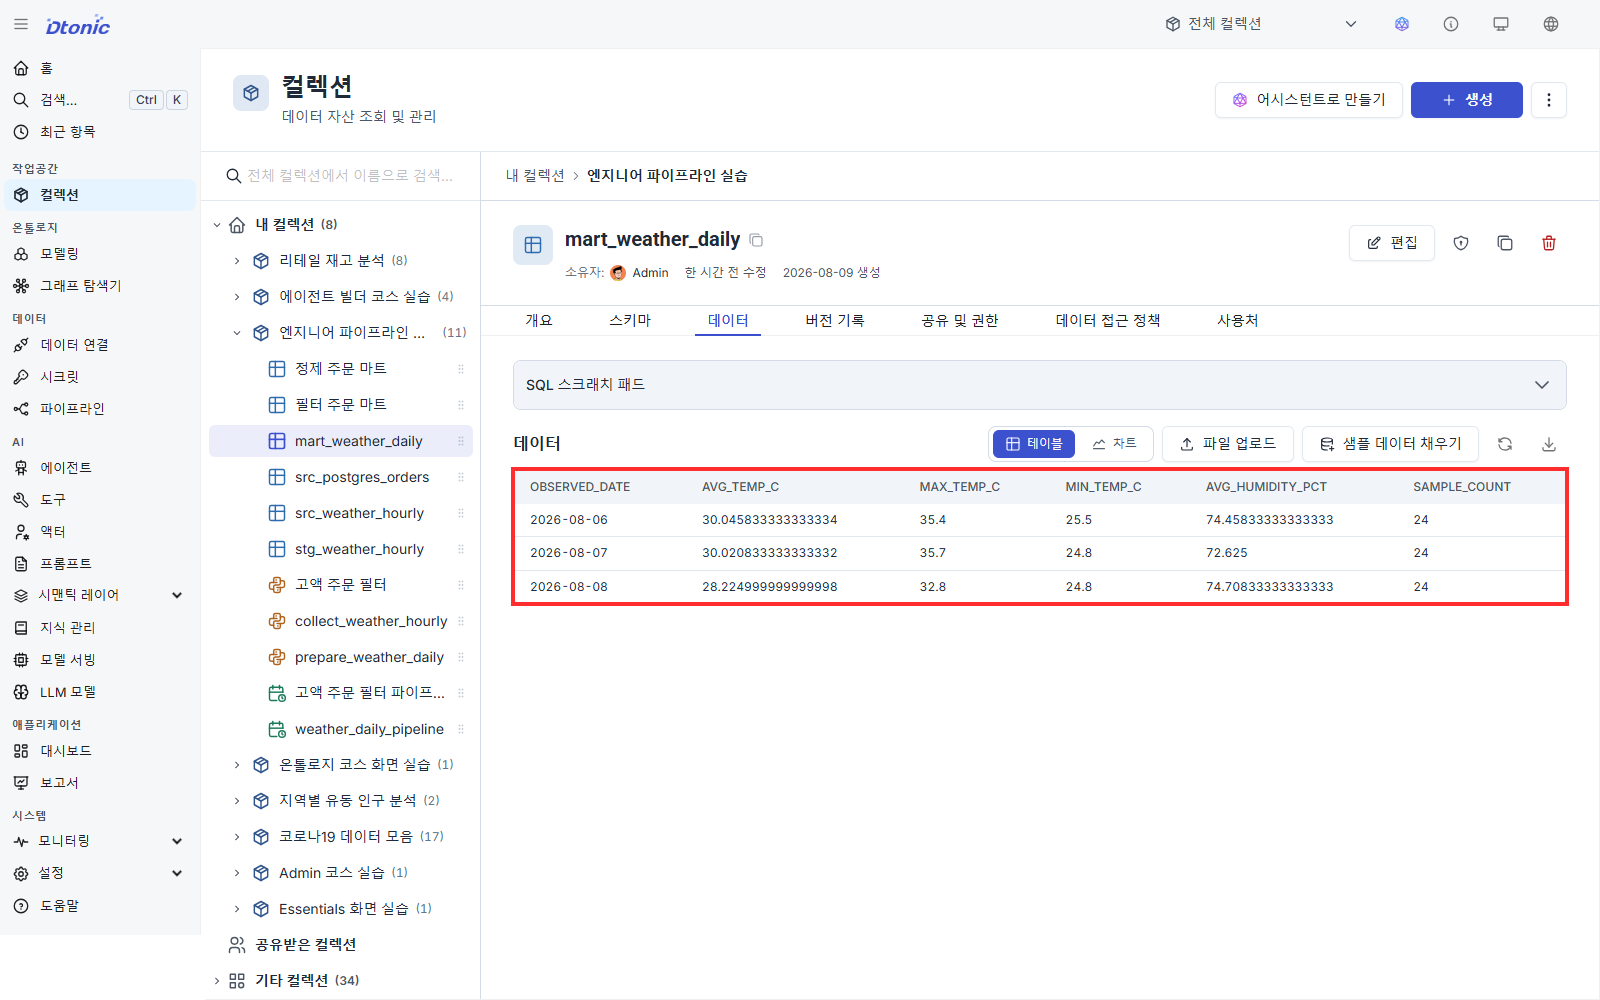
stg_weather_hourly:observed_at,observed_date,temperature_c,humidity_pctmart_weather_daily:observed_date,avg_temp_c,max_temp_c,min_temp_c,avg_humidity_pct,sample_count
Use Double for avg_humidity_pct and Bigint for sample_count.
Create the preparation code
- In the practice collection, choose Add item → Code → Python.
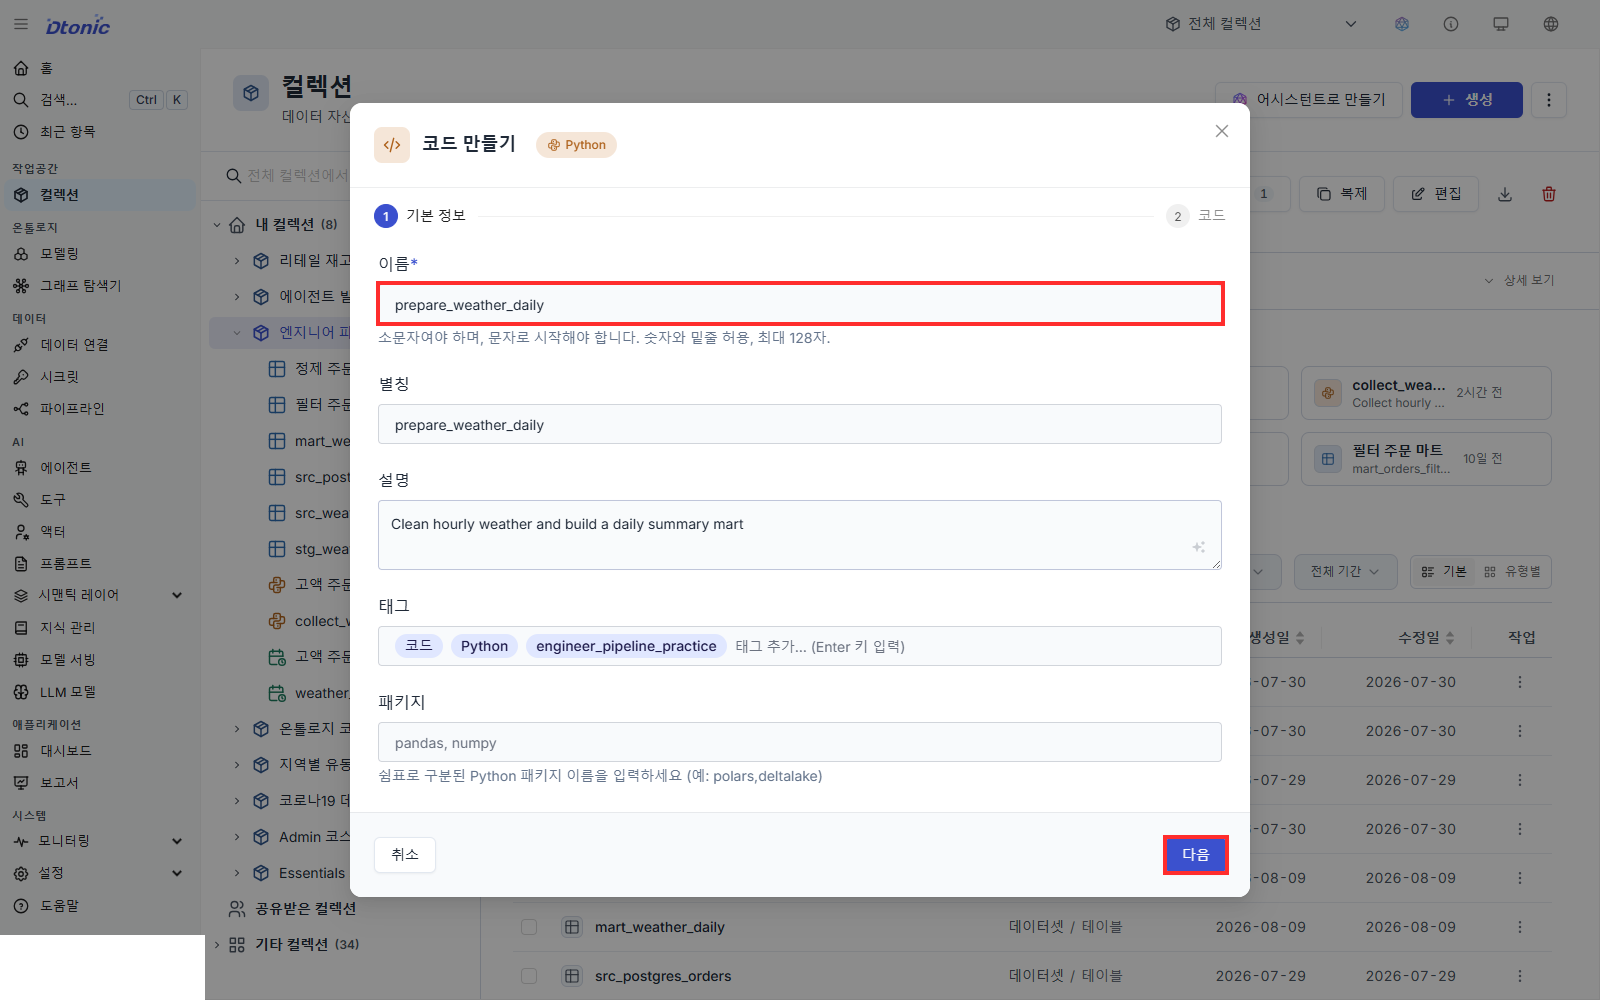
- Enter
prepare_weather_dailyfor both the name and alias. - Add a short description and choose Next.
Replace the editor contents with the following code and choose Create.
def run(src_weather_hourly, options=None, contexts=None):
    import polars as pl

    frame = src_weather_hourly.rename({
        "temperature_2m": "temperature_c",
        "relative_humidity_2m": "humidity_pct",
    })
    daily = (
        frame.group_by("observed_date")
        .agg(
            pl.col("temperature_c").mean().alias("avg_temp_c"),
            pl.col("temperature_c").max().alias("max_temp_c"),
            pl.col("temperature_c").min().alias("min_temp_c"),
            pl.col("humidity_pct").mean().alias("avg_humidity_pct"),
            pl.col("observed_at").count().alias("sample_count"),
        )
        .sort("observed_date")
    )
    return {
        "stg_weather_hourly": frame,
        "mart_weather_daily": daily,
    }
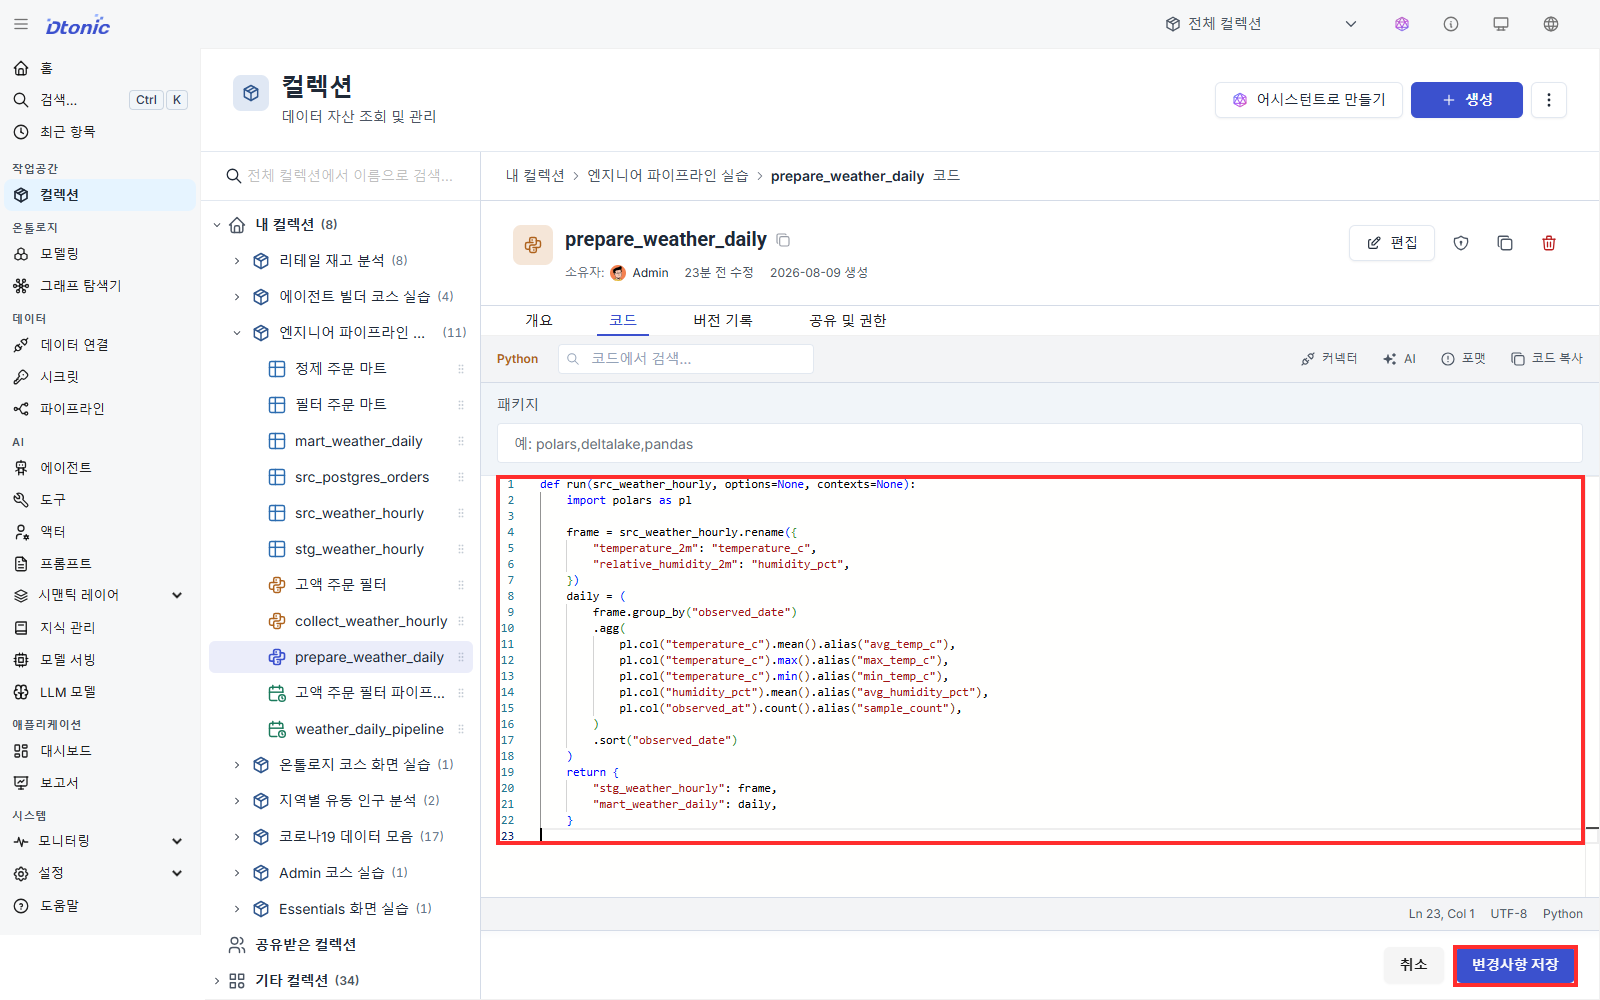
Dataset inputs arrive as Polars DataFrame objects, so use rename() and group_by() rather than pandas copy() and groupby().
Connect the pipeline
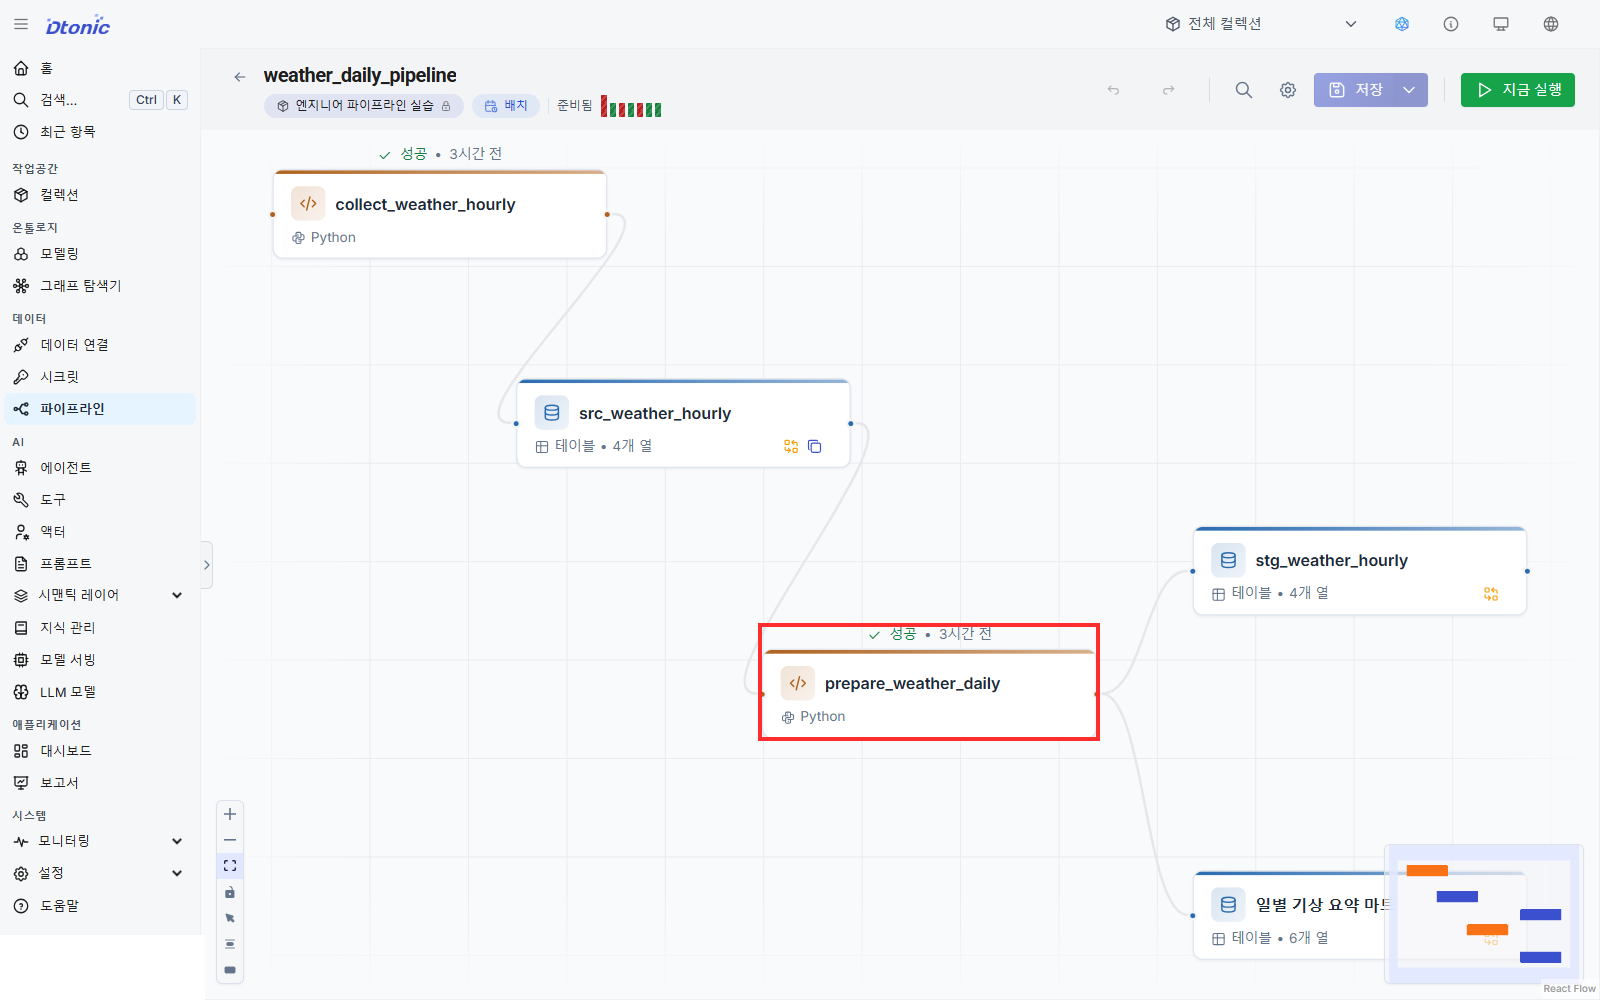
- Open
weather_daily_pipelineand expand the Component Library. - Drag
prepare_weather_daily,stg_weather_hourly, andmart_weather_dailyonto the canvas. - Connect
src_weather_hourlytoprepare_weather_daily. - Connect the code output to both result datasets.
Set full read and overwrite
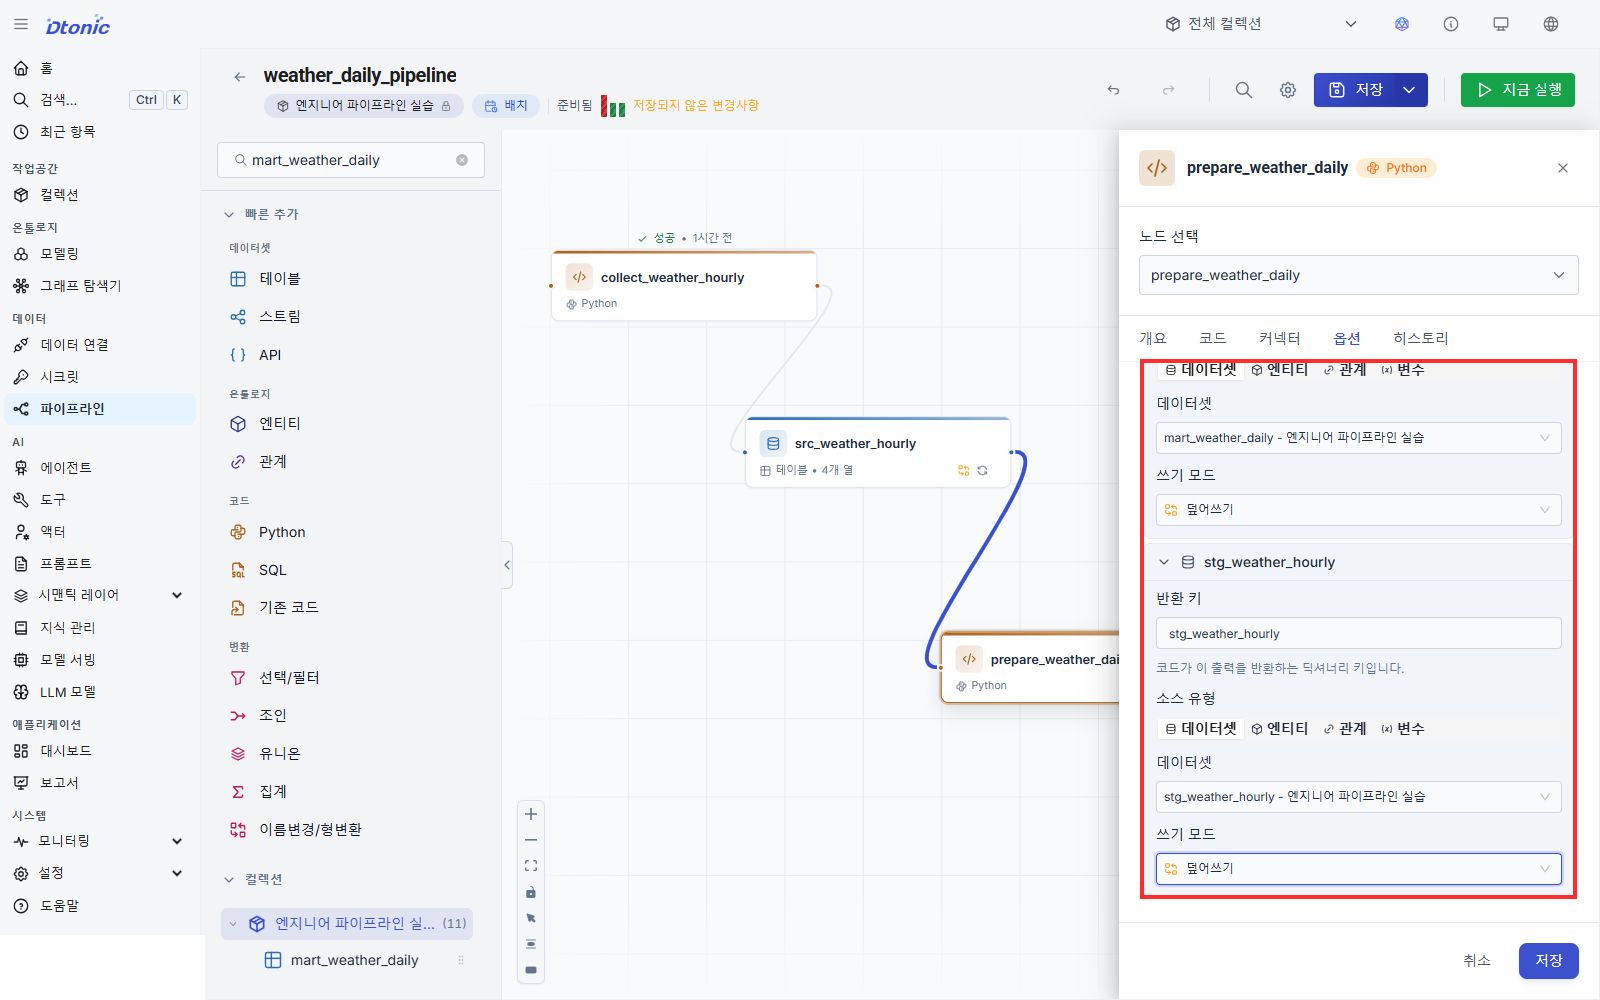
Select prepare_weather_daily and open Options.
- Expand the
src_weather_hourlyinput and choose Read mode → Full. - Expand both outputs and choose Write mode → Overwrite.
- Save the inspector and then save the pipeline.
Run and verify
Choose Run now and confirm that both code nodes succeed. The staged dataset must contain 72 rows with temperature_c and humidity_pct; the mart must contain three dates with sample_count equal to 24.
Self-check
prepare_weather_dailyuses Polars syntax.- Its input uses Full and both outputs use Overwrite.
- The staged dataset has 72 rows.
- The mart has three rows and every
sample_countis 24.
Next lesson
Next, schedule this verified pipeline to run automatically.
Before you finish
Use these questions to check whether you achieved this lesson's goal.
- Can you repeat ‘Clean the raw data and build a daily mart with code’ without following the instructions?
- Can you name at least one place to check when the result differs from what you expected?